LED Flashlight Optical Metrics Explained for Buyers
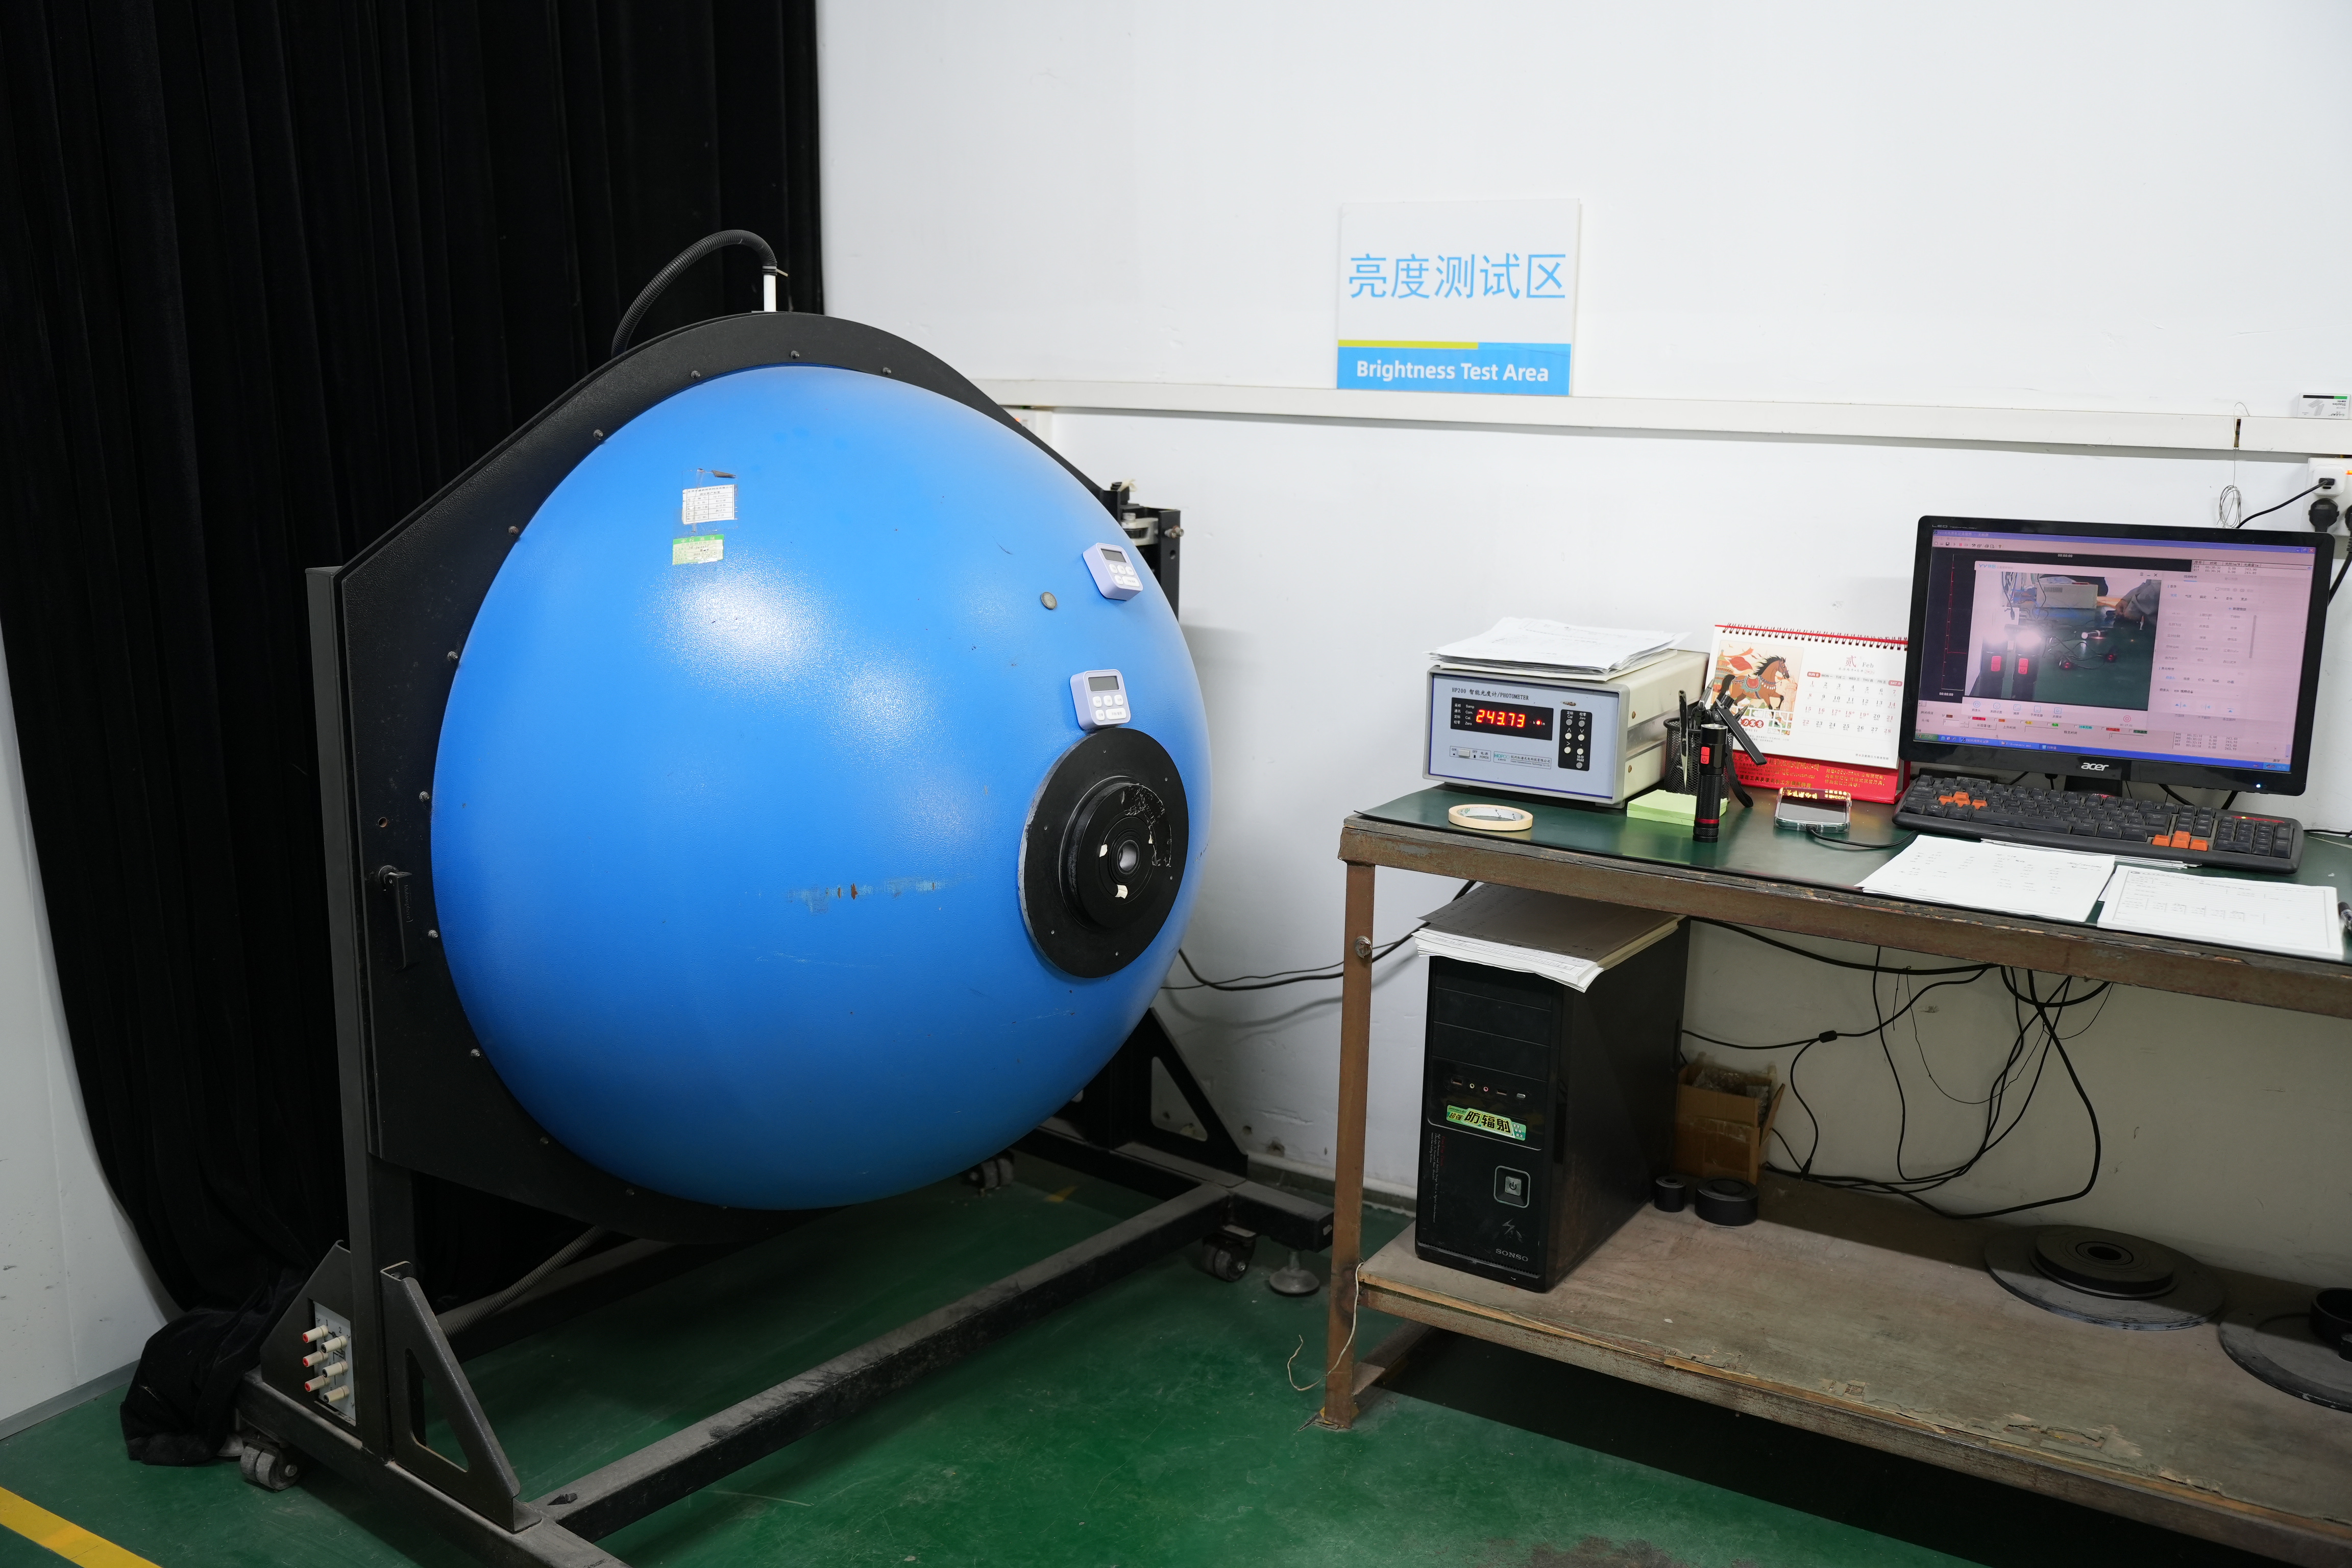
Direct answer: LED flashlight optical metrics describe different parts of performance. Lumens measure total visible light output; candela describes peak beam intensity; lux is illuminance arriving on a surface; beam distance is derived from intensity using a defined threshold. Correlated color temperature describes the apparent tone of white light, while color-rendering measures help describe how colors appear. No single metric determines whether a flashlight is suitable—the beam profile, regulation, runtime and test conditions must be considered together.
For buyers, the central rule is simple: compare like with like. A component LED rating is not the same as finished-flashlight output. A high lumen value does not guarantee long range. A long beam-distance claim does not show spill width, near-field usability or sustained output. The most useful evidence combines calibrated measurements with a full runtime curve, controlled beam images and identification of the exact LED, optic, driver, battery and mode.
Every optical measurement also has uncertainty. Equipment calibration, sphere geometry, detector response, alignment, distance, stray light and sample variation all contribute. A responsible comparison does not overstate tiny differences that may sit inside the method’s uncertainty or normal production spread. The report should provide enough information to understand precision, sample count and repeatability, especially when a packaging claim is set close to an acceptance limit.
1. Start With the Complete Optical System
An LED is one component in an optical system. Light leaves the LED package, passes through or reflects from an optic, travels through a protective window and forms a beam. The driver determines current, the battery supplies changing voltage, and the housing removes heat. Each element can change the measured result.
Reflectors and total-internal-reflection lenses can be designed for different distributions. A smooth reflector may create a defined central hotspot and spill; a textured surface can blend artifacts; a TIR optic can collect and redirect light in compact geometry. Lens transmission, coating, bezel shadowing, LED centering and manufacturing tolerance influence efficiency and beam shape. Therefore, the LED manufacturer’s data cannot substitute for measurement of the assembled flashlight.
The flashlight category, headlamp range and tooling lights serve different beam tasks. Their category names are a starting point; the exact beam pattern and measurements remain model specific.
2. Lumens: Total Visible Light Output
Luminous flux, reported in lumens, represents the total visible light emitted by the product. It is commonly measured with an integrating sphere or another suitable photometric system. The key phrase is “finished product”: losses in the optic, protective window and mechanical structure mean the flashlight output will differ from the bare LED’s laboratory rating.
The test record should identify the mode, timing convention, battery, state of charge, ambient condition, equipment and calibration. Output can change quickly after activation because of thermal regulation or a short-duration boost mode. A single “maximum lumens” value is incomplete when it is not connected to time and temperature.
More lumens can increase useful illumination, but distribution matters. A wide flood beam may place light across a large work area; a narrow beam may concentrate less total light into a much brighter center. Application requirements should decide which distribution is more useful.
3. Candela, Lux and Beam Distance
Candela expresses luminous intensity in a direction. Flashlight specifications usually report peak beam intensity: the brightest part of the beam under the test geometry. A higher candela value generally indicates a more concentrated peak, but it does not reveal the width or uniformity of the surrounding beam.
Lux measures illuminance on a surface. It changes with distance and beam geometry. A lux meter reading is meaningful only when the distance, alignment, environment, meter and calculation are documented. Stray light, incorrect distance or measuring before the beam stabilizes can distort the result.
Beam distance is derived from peak intensity using a defined illuminance threshold in the applicable performance method. It is a standardized comparison value, not a guarantee that a user can identify a target at that distance in fog, rain, smoke, glare or low-contrast terrain. Operational visibility also depends on eyesight, target reflectivity, atmosphere and beam spill.
| Metric | Primary question | What it does not show alone | Useful supporting evidence |
|---|---|---|---|
| Lumens | How much visible light exits the product? | Beam concentration or sustained output | Sphere report and runtime curve |
| Candela | How intense is the peak beam? | Spill width, uniformity or color | Distance setup and beam image |
| Beam distance | What standardized distance follows from intensity? | Real-world target recognition | Candela result and applicable method |
| CCT / color quality | What is the light’s apparent tone and color-rendering behavior? | Brightness, range or runtime | Spectral or colorimetric report |
4. CCT, Tint and Color Rendering
Correlated color temperature (CCT) describes whether white light appears relatively warm, neutral or cool. It is not a direct measure of quality. A cooler source may appear visually bright in some contexts; a warmer or neutral source may improve comfort or contrast in others. The application, surrounding materials and atmospheric conditions influence preference.
Two LEDs with the same nominal CCT can appear different because tint can shift relative to the black-body reference and can vary across the beam. Optics, current and temperature may change perceived color. If color consistency matters, the specification should define an acceptable bin or tolerance and identify where and when measurements are taken.
Color rendering describes how faithfully colors appear under a source compared with a reference. CRI is widely recognized, but one average value does not describe every color sample or task. Inspection, medical, electrical-wire identification and finish evaluation may require more detailed spectral or color-rendering criteria. Higher color quality can involve trade-offs with output or efficiency, so the requirement should reflect the actual work.
5. Beam Profile and Artifacts
Beam profile is the spatial distribution users actually see. Important features include hotspot diameter, transition, spill width, edge, rings, shadows and color separation. A smooth wall beam image can reveal artifacts, but it should be captured with fixed exposure, white balance, distance and camera position. Automatic camera settings make cross-product comparison unreliable.
A uniform flood beam may be ideal for close inspection but inefficient for long-range identification. A sharp hotspot may deliver distance but create glare on nearby surfaces. Multi-emitter or zoomable systems add alignment and uniformity questions. Buyers should define the target distance, field width and task before selecting an optic.
6. Runtime and Thermal Stability Complete the Picture
Optical values change with time. LED efficiency and forward voltage depend on temperature, the battery voltage declines, and the driver may reduce current. A flashlight that measures high output shortly after activation may stabilize at a lower level. For real sourcing decisions, the runtime graph should show output from activation through regulation and cutoff.
Ask for the battery, mode, ambient temperature, airflow, sample orientation and measurement interval. If a product has a boost mode, distinguish peak from sustained performance. SHENGQI LIGHTING’s testing context and quality overview can support a technical discussion, but each result still needs traceability to the exact product.
7. Buyer Verification Checklist
- Confirm the exact model, LED, optic, driver, firmware, battery and mode.
- Separate finished-product measurements from LED component data.
- Record equipment, calibration, ambient condition, timing and test method.
- Compare lumens, candela, beam profile, CCT, color quality and runtime together.
- Request raw values or curves, not only packaging numbers.
- Define retest or change-control requirements when critical components change.
Frequently Asked Questions
Are lumens the same as brightness?
Lumens measure total visible output. Perceived brightness depends on beam concentration, surroundings, adaptation and where the light lands, so lumens alone are incomplete.
Why can a lower-lumen flashlight reach farther?
Its optic may concentrate more light into the central beam, creating higher peak candela and therefore a greater standardized beam distance.
Is a higher CCT better?
No. CCT describes the apparent tone of white light, not overall quality. The best range depends on task, environment, contrast and user preference.
Does CRI show every aspect of color quality?
No. CRI is useful, but an average value may not represent every color or application. More detailed spectral or rendering data may be needed for critical inspection.
What is the minimum evidence for comparing two flashlights?
Use measurements from finished products under the same method and conditions, with the exact configuration identified, plus beam images and output-versus-time curves.
Define the Optical Evidence Before Comparing Models
For an OEM project, align the beam task, photometric metrics, test conditions and reporting format before approving product claims.
Contact the Engineering Team